今回は、前回紹介した「【Monaca】D3.jsを使用して折れ線グラフを表示する」のコードを流用し、グラフに複数の折れ線を表示する方法について紹介します。
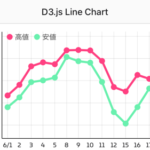
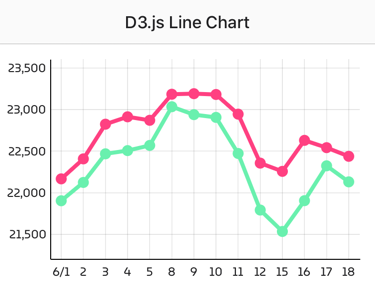
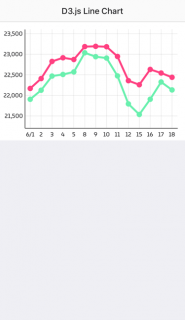
日経平均の高値と安値を折れ線グラフに表示します。
Monacaデバッガーの結果です。
まず、2次元配列を以下のように変更します。
app.js
|
1 2 3 4 5 6 7 8 9 10 11 12 13 14 15 16 17 18 19 20 |
"use strict"; ons.ready(function () { var data = [ ["20200601", 22161, 21898], ["20200602", 22401, 22118], ["20200603", 22818, 22462], ["20200604", 22907, 22501], ["20200605", 22865, 22563], ["20200608", 23178, 23028], ["20200609", 23185, 22933], ["20200610", 23175, 22900], ["20200611", 22939, 22466], ["20200612", 22350, 21786], ["20200615", 22251, 21529], ["20200616", 22624, 21899], ["20200617", 22536, 22318], ["20200618", 22432, 22125] ]; window.fn.chart.createLineChart("chart", data); }); |
CSSに以下のコードを追加します。
style.css
|
1 2 3 4 5 6 7 8 9 10 |
.line-green { fill: none; stroke: #69f0ae; stroke-width: 4px; } .point-green { fill: #69f0ae; stroke: #69f0ae; stroke-width: 1px; } |
複数の折れ線を表示する場合の注意点は、ハイライト行の箇所です。
折れ線の点を表示するselectAll()でcircleを指定すると、2本目の点が表示されません。
1本目の点をselectAll(“circle.red”)、2本目の点をselectAll(“circle.green”)と指定すると表示することができます。
d3chart.js
|
1 2 3 4 5 6 7 8 9 10 11 12 13 14 15 16 17 18 19 20 21 22 23 24 25 26 27 28 29 30 31 32 33 34 35 36 37 38 39 40 41 42 43 44 45 46 47 48 49 50 51 52 53 54 55 56 57 58 59 60 61 62 63 64 65 66 67 68 69 70 71 72 73 74 75 76 77 78 79 80 81 82 83 84 85 86 87 88 89 90 91 92 93 94 95 96 97 98 99 100 101 102 103 104 105 106 107 108 109 110 111 112 113 114 115 116 117 118 119 120 121 122 123 124 125 126 127 128 129 130 131 132 133 |
"use strict"; //************************************************************ // module: d3chart.js // author: otak-lab // use: d3.min.js //************************************************************ if (!window.hasOwnProperty("fn")) { window.fn = {}; } window.fn.chart = {}; //************************************************************ // create line chart //************************************************************ window.fn.chart.createLineChart = function (id, data) { var elem = document.getElementById(id); if (!elem) return; if (data.length == 0) return; // margin var margin = { top: 15, right: 15, bottom: 25, left: 50 }; // width, height var w = elem.clientWidth - (margin.left + margin.right); var h = elem.clientHeight - (margin.top + margin.bottom); // min, max var min = Math.min.apply(null, data.map(function (d) { return Math.min(d[1], d[2]); })); var max = Math.max.apply(null, data.map(function (d) { return Math.max(d[1], d[2]); })); if (min < 0) { min += Math.floor(min * 0.01); } else if (min > 0) { min -= Math.floor(max * 0.01); } if (max > 0) { max += Math.floor(max * 0.01); } else if (max < 0) { max -= Math.floor(min * 0.01); } // y var y = d3.scaleLinear() .domain([min, max]) .nice() .range([h, 0]); // x var x = d3.scaleBand() .domain(data.map(function (d) { return d[0]; })) .range([0, w]); // adjust line x positon var pos = (x(data[1][0]) - x(data[0][0])) / 2; // axis var yAxis = d3.axisLeft(y) .tickSizeInner(-w) .tickSizeOuter(0) .tickPadding(4) .tickFormat(function (d) { return d3.format(",")(d); }) .ticks(7); var yRange = yAxis.scale().domain(); var xAxis = d3.axisBottom(x) .tickValues(x.domain()) .tickSizeInner(-h) .tickSizeOuter(0) .tickPadding(8) .tickFormat(function (d, i) { var result = Number(d.substr(6, 2)).toString(); if (i == 0) result = Number(d.substr(4, 2)).toString() + "/" + result; return result; }); // line var line = d3.line() .x(function (d) { return (x(d[0]) + pos); }) .y(function (d) { return y(d[1]); }) .curve(d3.curveLinear); var line2 = d3.line() .x(function (d) { return (x(d[0]) + pos); }) .y(function (d) { return y(d[2]); }) .curve(d3.curveLinear); // remove chart d3.select("#d3-chart").remove(); // create svg var svg = d3.select(elem) .append("svg") .attr("id", "d3-chart") .attr("width", elem.clientWidth.toString() + "px") .attr("height", elem.clientHeight.toString() + "px") .append("g") .attr("transform", "translate(" + margin.left.toString() + ", " + margin.top.toString() + ")"); // create x svg.append("g") .attr("class", "axis") .attr("transform", "translate(0, " + h.toString() + ")") .call(xAxis); // create y svg.append("g") .attr("class", "axis") .call(yAxis); // line svg.append("path") .attr("class", "line-red") .attr("d", line(data)); // point svg.selectAll("circle.red") .data(data) .enter() .append("circle") .attr("class", "point-red") .attr("cx", function (d) { return (x(d[0]) + pos); }) .attr("cy", function (d) { return y(d[1]); }) .attr("r", "5px"); // line2 svg.append("path") .attr("class", "line-green") .attr("d", line2(data)); // point2 svg.selectAll("circle.green") .data(data) .enter() .append("circle") .attr("class", "point-green") .attr("cx", function (d) { return (x(d[0]) + pos); }) .attr("cy", function (d) { return y(d[2]); }) .attr("r", "5px"); }; |