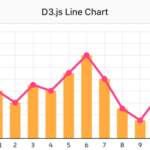
私が開発したアプリの折れ線グラフは、すべてD3.jsを使用しています。

「どうやって折れ線グラフを表示しているのか」など問い合わせが多いため、今回はコピー&ペーストすればアプリに使える、折れ線グラフを表示する方法について紹介します。
d3.min.jsを[js]フォルダにアップロードしてください。
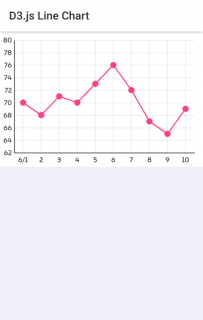
2次元配列dataに年月日と数値を設定し、window.fn.chart.createLineChart(“chart”, data)を実行すれば、折れ線グラフが表示されます。
※見た目が少し変わるように、Google Fontsを使用しています。
Monacaデバッガーの結果です。
iOS版
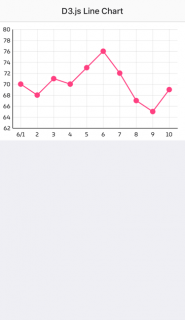
Android版
index.html
|
1 2 3 4 5 6 7 8 9 10 11 12 13 14 15 16 17 18 19 20 21 22 23 24 25 26 27 28 |
<!DOCTYPE HTML> <html> <head> <meta charset="utf-8"> <meta name="viewport" content="width=device-width, initial-scale=1, maximum-scale=1, user-scalable=no, viewport-fit=cover"> <meta http-equiv="Content-Security-Policy" content="default-src * data: gap: https://ssl.gstatic.com; style-src * 'unsafe-inline'; script-src * 'unsafe-inline' 'unsafe-eval'"> <script src="components/loader.js"></script> <script src="lib/onsenui/js/onsenui.min.js"></script> <link rel="stylesheet" href="components/loader.css"> <link rel="stylesheet" href="lib/onsenui/css/onsenui.css"> <link rel="stylesheet" href="lib/onsenui/css/onsen-css-components.css"> <link rel="stylesheet" href="css/style.css"> <link rel="stylesheet" href="https://fonts.googleapis.com/css?family=MuseoModerno&display=swap"> <script src="js/d3.min.js"></script> <script src="js/d3chart.js"></script> <script src="js/app.js"></script> </head> <body> <ons-page> <ons-toolbar> <div class="center">D3.js Line Chart</div> </ons-toolbar> <div id="chart"></div> </ons-page> </body> </html> |
style.css
|
1 2 3 4 5 6 7 8 9 10 11 12 13 14 15 16 17 18 19 20 21 22 23 24 25 26 27 28 29 30 31 |
#chart { width: 100%; height: 240px; } #d3-chart { background-color: #fff; } .axis text { font-size: 12px; font-family: "MuseoModerno", cursive; } .axis path, .axis line { fill: none; stroke: #000; stroke-width: 1px; } .tick line { opacity: 0.1; stroke-width: 1px; } .line-red { fill: none; stroke: #ff4081; stroke-width: 2px; } .point-red { fill: #ff4081;; stroke: #ff4081; stroke-width: 1px; } |
app.js
|
1 2 3 4 5 6 7 8 9 10 11 12 13 14 15 16 |
"use strict"; ons.ready(function () { var data = [ ["20200601", 70], ["20200602", 68], ["20200603", 71], ["20200604", 70], ["20200605", 73], ["20200606", 76], ["20200607", 72], ["20200608", 67], ["20200609", 65], ["20200610", 69] ]; window.fn.chart.createLineChart("chart", data); }); |
d3chart.js
|
1 2 3 4 5 6 7 8 9 10 11 12 13 14 15 16 17 18 19 20 21 22 23 24 25 26 27 28 29 30 31 32 33 34 35 36 37 38 39 40 41 42 43 44 45 46 47 48 49 50 51 52 53 54 55 56 57 58 59 60 61 62 63 64 65 66 67 68 69 70 71 72 73 74 75 76 77 78 79 80 81 82 83 84 85 86 87 88 89 90 91 92 93 94 95 96 97 98 99 100 101 102 103 104 105 106 107 108 109 110 111 |
"use strict"; //************************************************************ // module: d3chart.js // author: otak-lab // use: d3.min.js //************************************************************ if (!window.hasOwnProperty("fn")) { window.fn = {}; } window.fn.chart = {}; //************************************************************ // create line chart //************************************************************ window.fn.chart.createLineChart = function (id, data) { var elem = document.getElementById(id); if (!elem) return; if (data.length == 0) return; // margin var margin = { top: 15, right: 15, bottom: 25, left: 25 }; // width, height var w = elem.clientWidth - (margin.left + margin.right); var h = elem.clientHeight - (margin.top + margin.bottom); // min, max var min = Math.min.apply(null, data.map(function (d) { return d[1]; })); var max = Math.max.apply(null, data.map(function (d) { return d[1]; })); if (min < 0) { min += Math.floor(min * 0.05); } else if (min > 0) { min -= Math.floor(max * 0.05); } if (max > 0) { max += Math.floor(max * 0.05); } else if (max < 0) { max -= Math.floor(min * 0.05); } // y var y = d3.scaleLinear() .domain([min, max]) .nice() .range([h, 0]); // x var x = d3.scaleBand() .domain(data.map(function (d) { return d[0]; })) .range([0, w]); // adjust line x positon var pos = (x(data[1][0]) - x(data[0][0])) / 2; // axis var yAxis = d3.axisLeft(y) .tickSizeInner(-w) .tickSizeOuter(0) .tickPadding(4) .tickFormat(function (d) { return d3.format(",")(d); }) .ticks(7); var xAxis = d3.axisBottom(x) .tickValues(x.domain()) .tickSizeInner(-h) .tickSizeOuter(0) .tickPadding(8) .tickFormat(function (d, i) { var result = Number(d.substr(6, 2)).toString(); if (i == 0) result = Number(d.substr(4, 2)).toString() + "/" + result; return result; }); // line var line = d3.line() .x(function (d) { return (x(d[0]) + pos); }) .y(function (d) { return y(d[1]); }) .curve(d3.curveLinear); // remove chart d3.select("#d3-chart").remove(); // create svg var svg = d3.select(elem) .append("svg") .attr("id", "d3-chart") .attr("width", elem.clientWidth.toString() + "px") .attr("height", elem.clientHeight.toString() + "px") .append("g") .attr("transform", "translate(" + margin.left.toString() + ", " + margin.top.toString() + ")"); // create x svg.append("g") .attr("class", "axis") .attr("transform", "translate(0, " + h.toString() + ")") .call(xAxis); // create y svg.append("g") .attr("class", "axis") .call(yAxis); // line svg.append("path") .attr("class", "line-red") .attr("d", line(data)); // point svg.selectAll("circle") .data(data) .enter() .append("circle") .attr("class", "point-red") .attr("cx", function (d) { return x(d[0]) + pos; }) .attr("cy", function (d) { return y(d[1]); }) .attr("r", "5px"); }; |